TRANSFORMING SALES DATA INTO CLEAR, ENGAGING REPORTS.
A fast-turnaround project designing a monthly, data-driven insights report for NZ auto dealers—turning complex analytics into clear, actionable visual storytelling.
I lead the design and creative direction, working closely with Emily Dinsdale (data scientist at Dot Loves Data) and the team at Trade Me Motors.
➔ See latest insightsI lead the design and creative direction, working closely with Emily Dinsdale (data scientist at Dot Loves Data) and the team at Trade Me Motors.

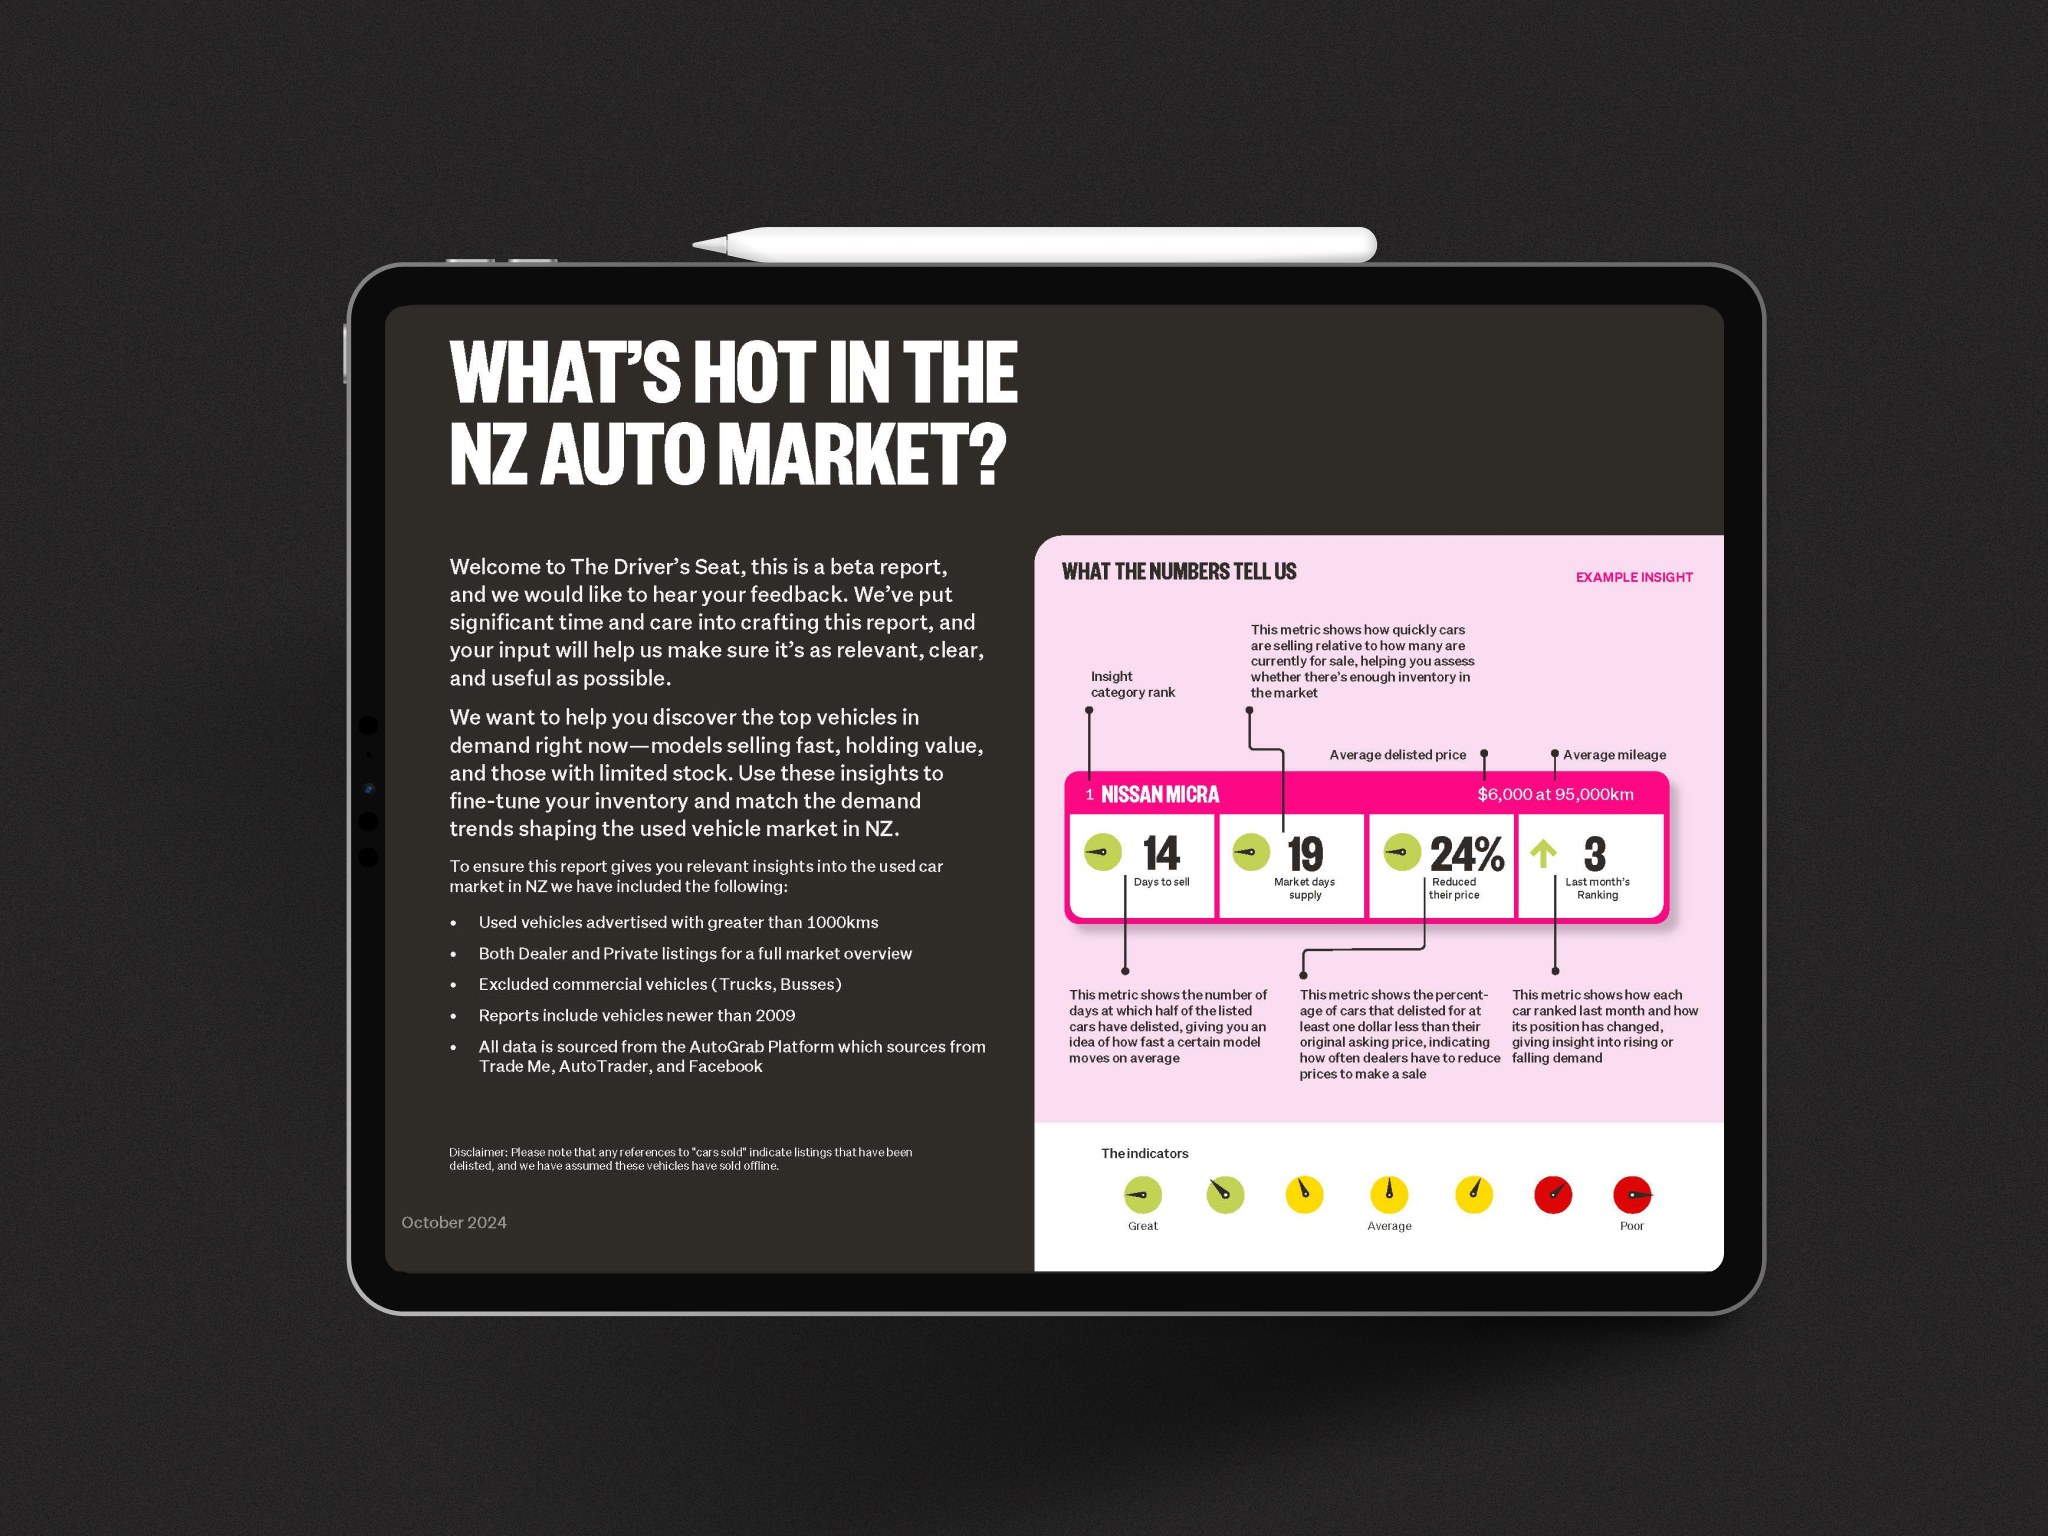
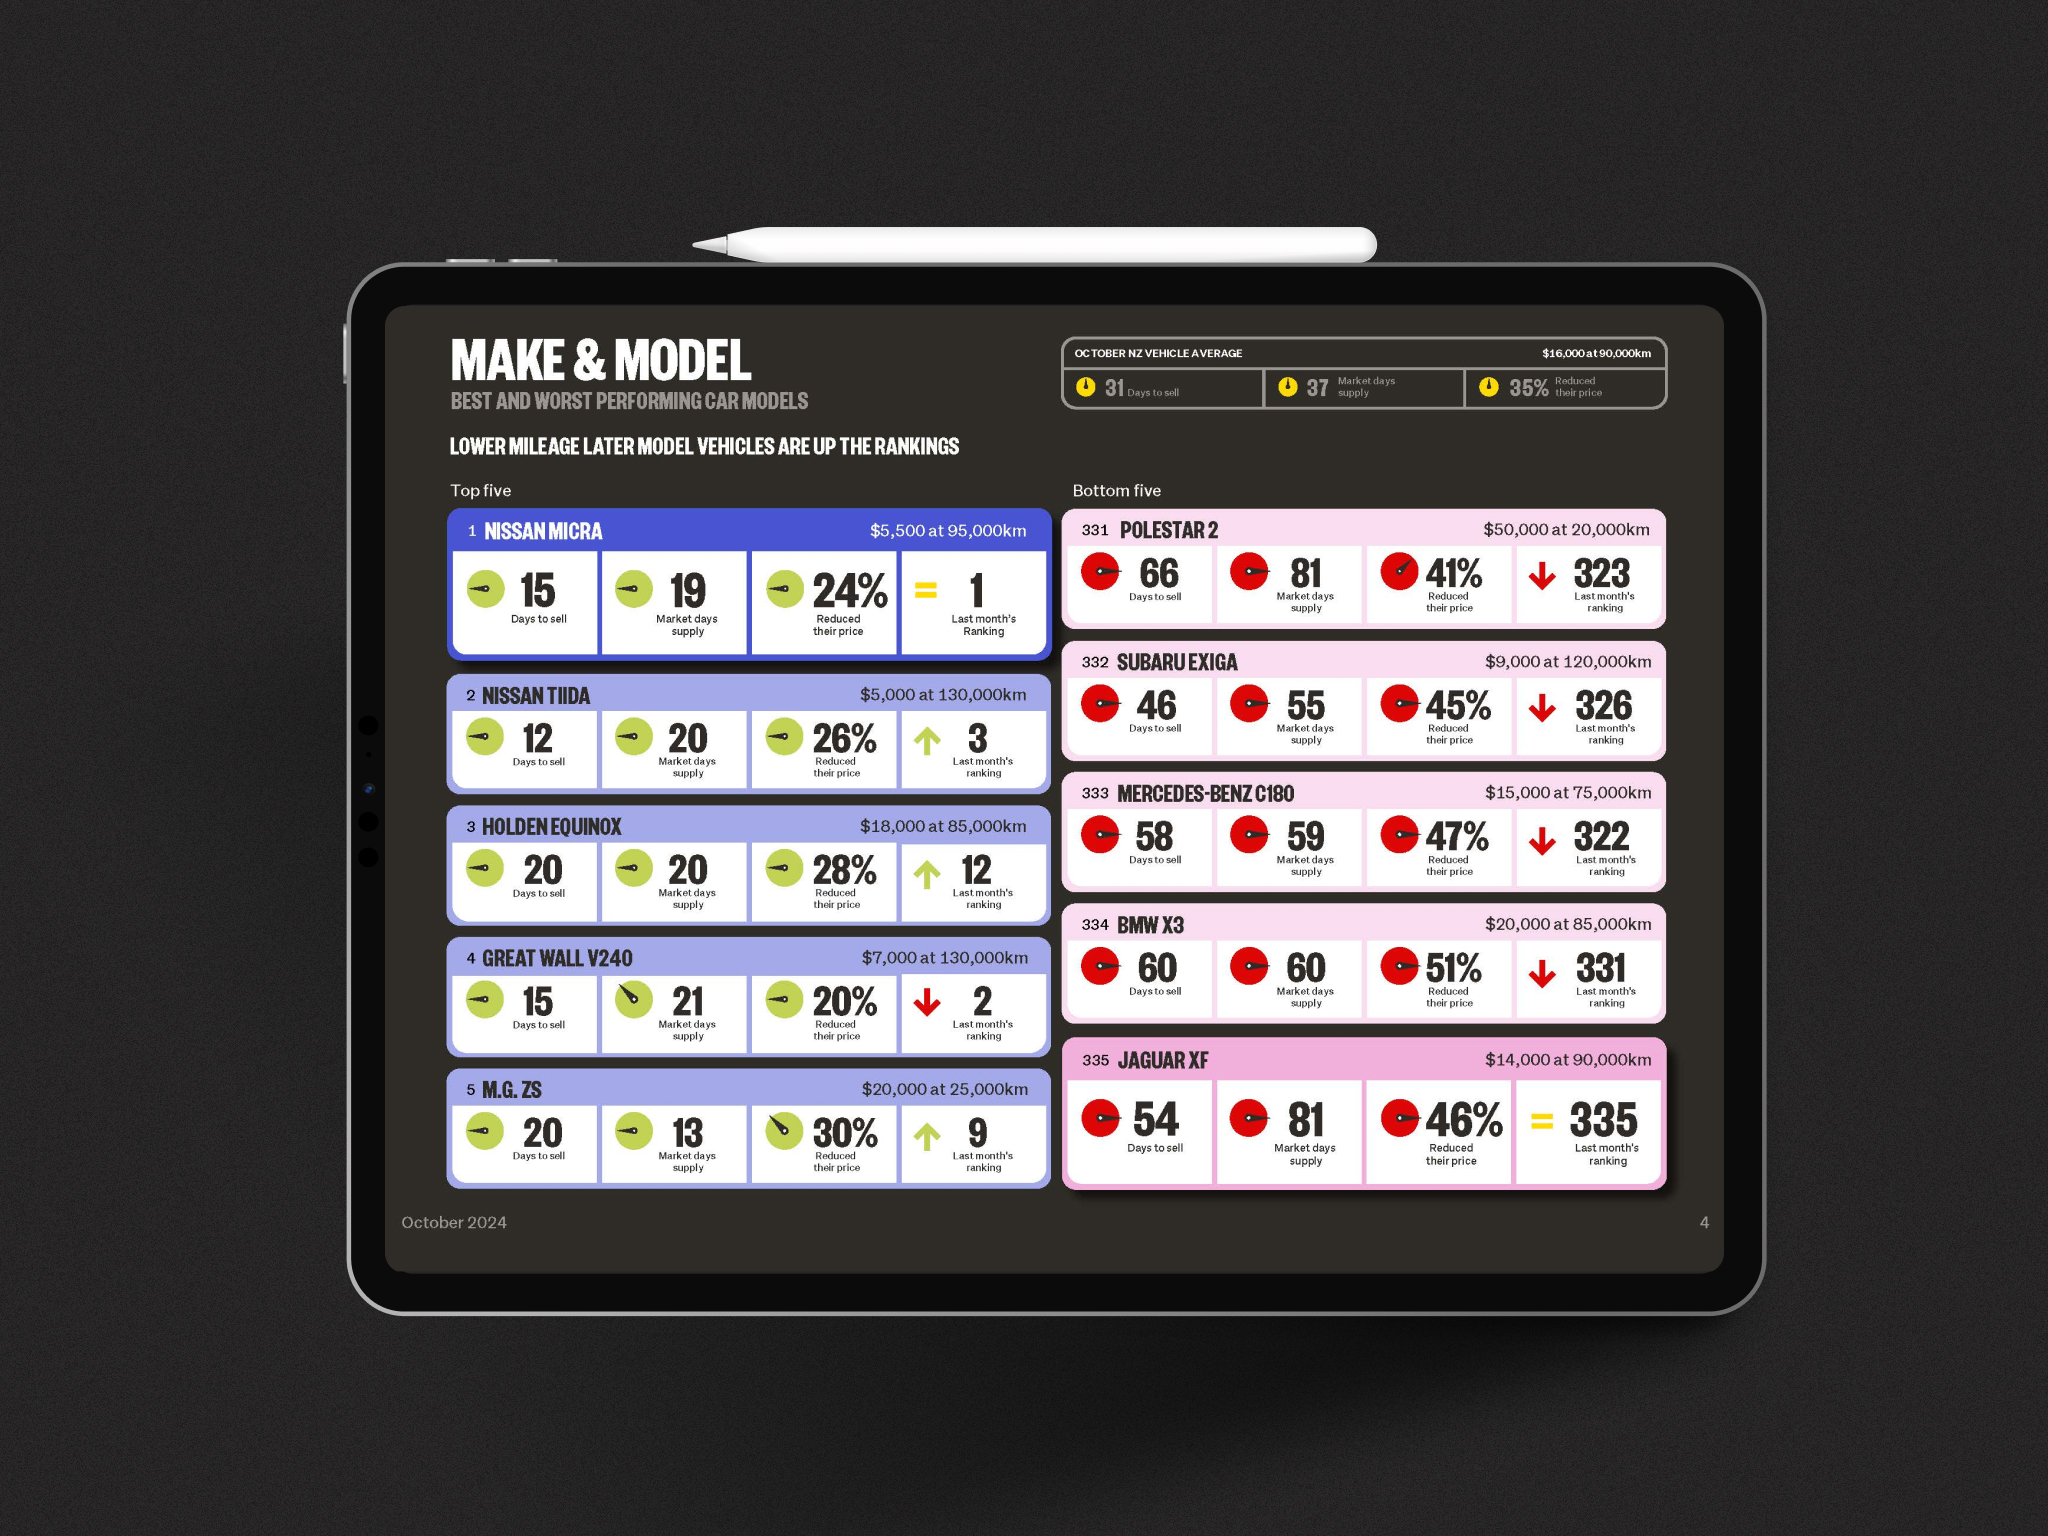
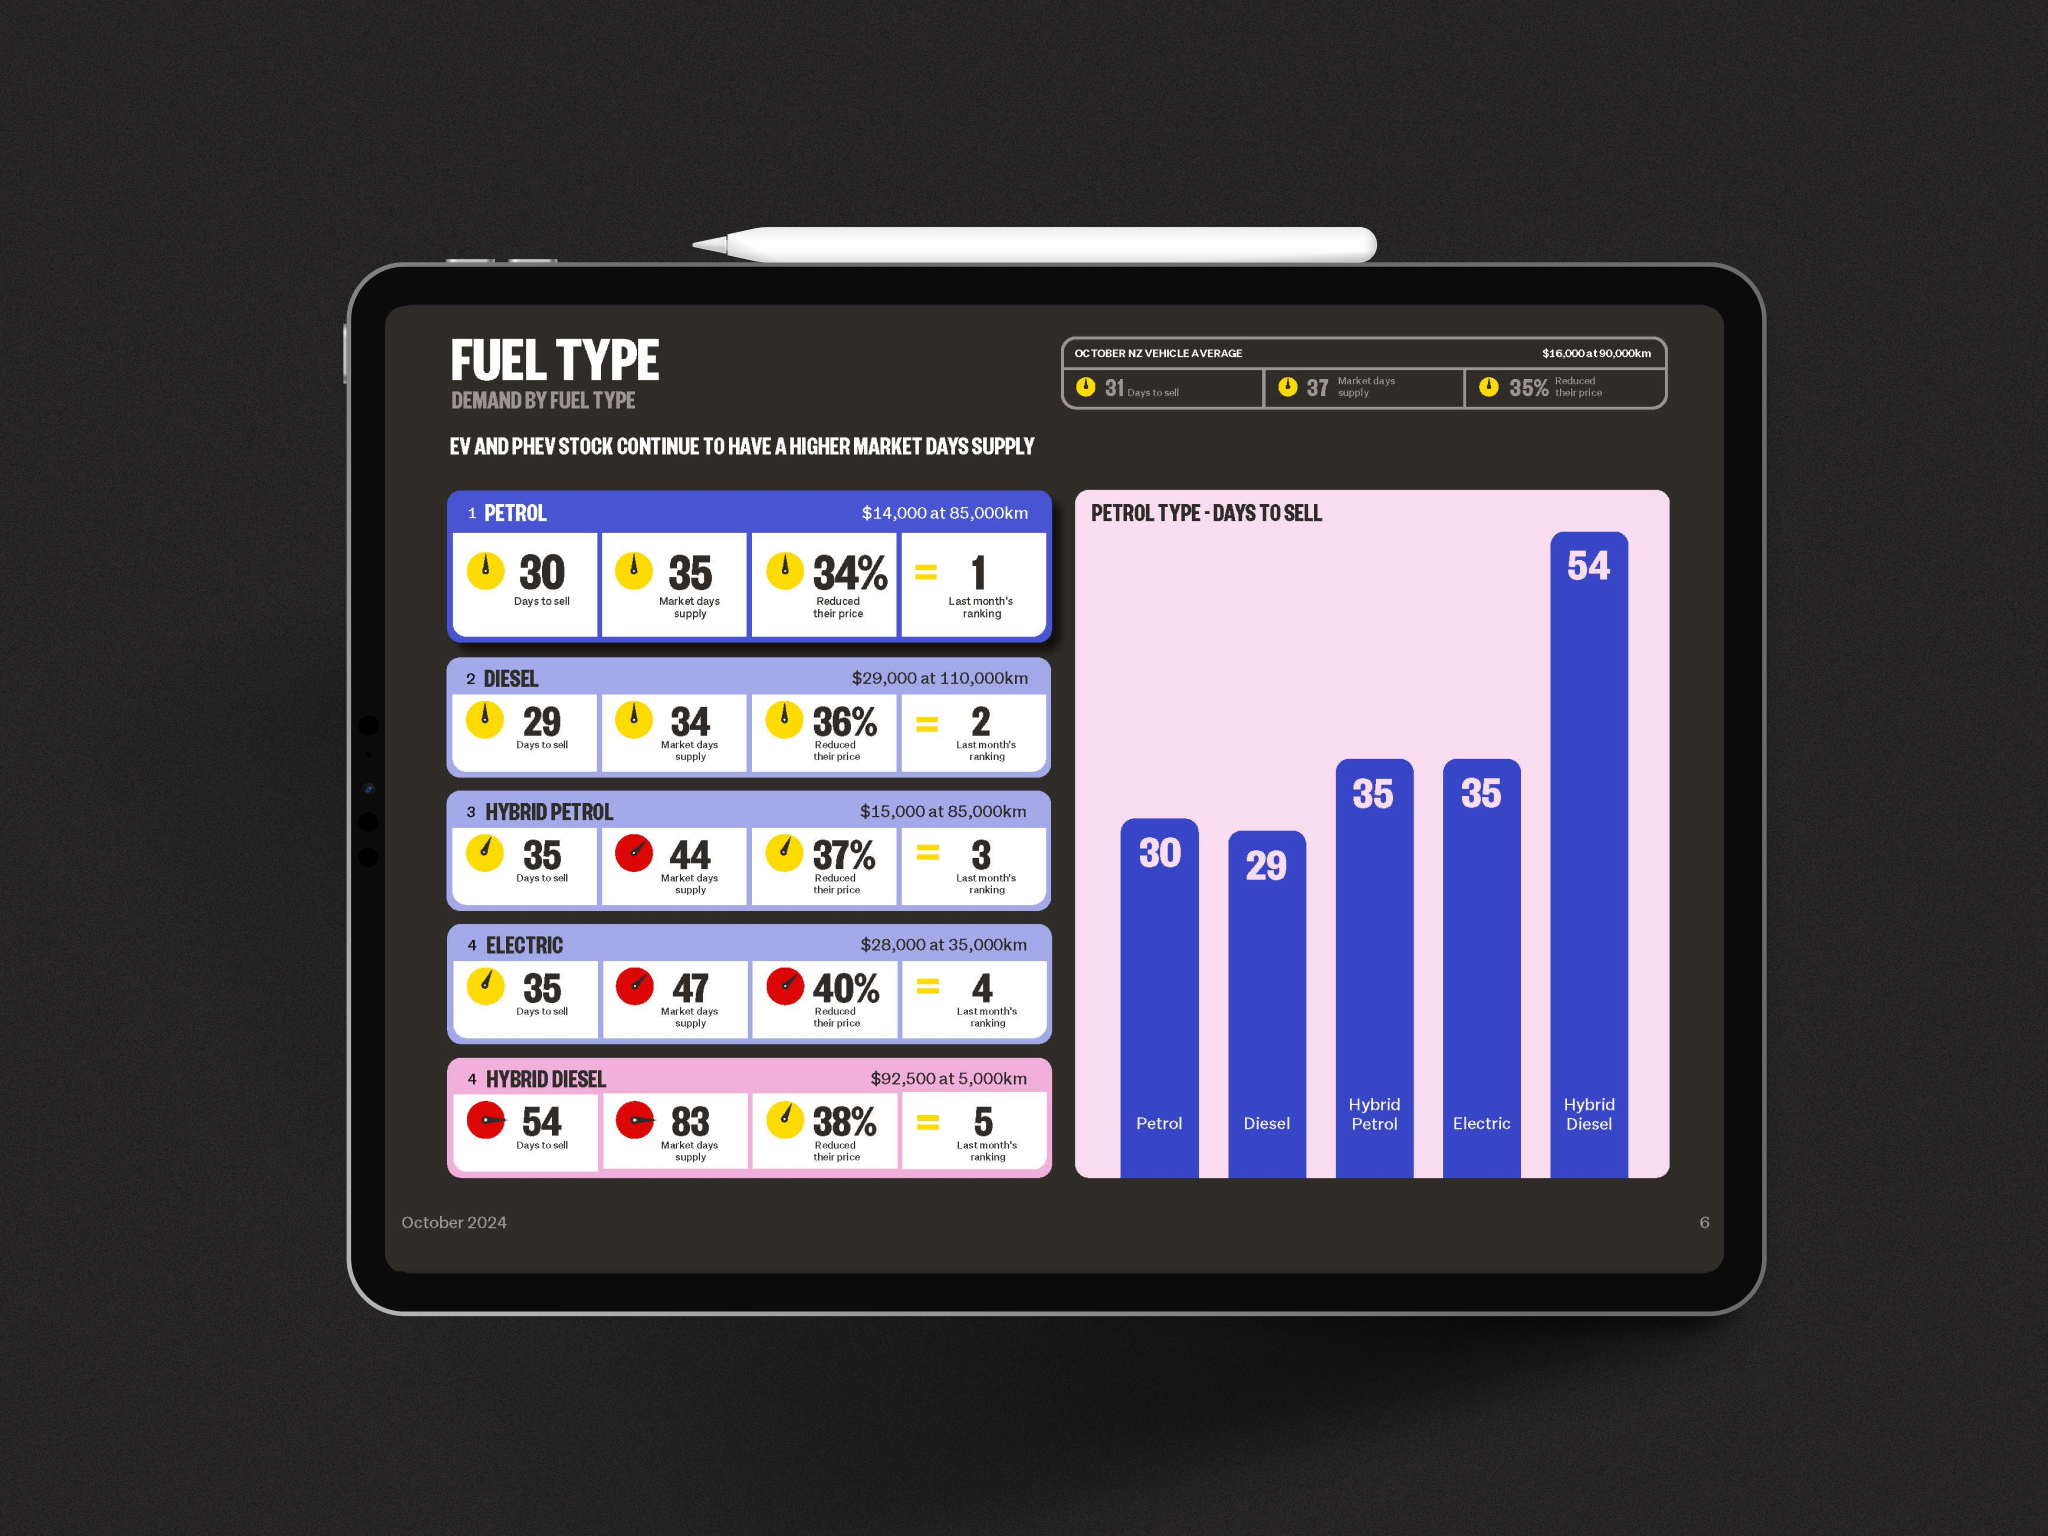
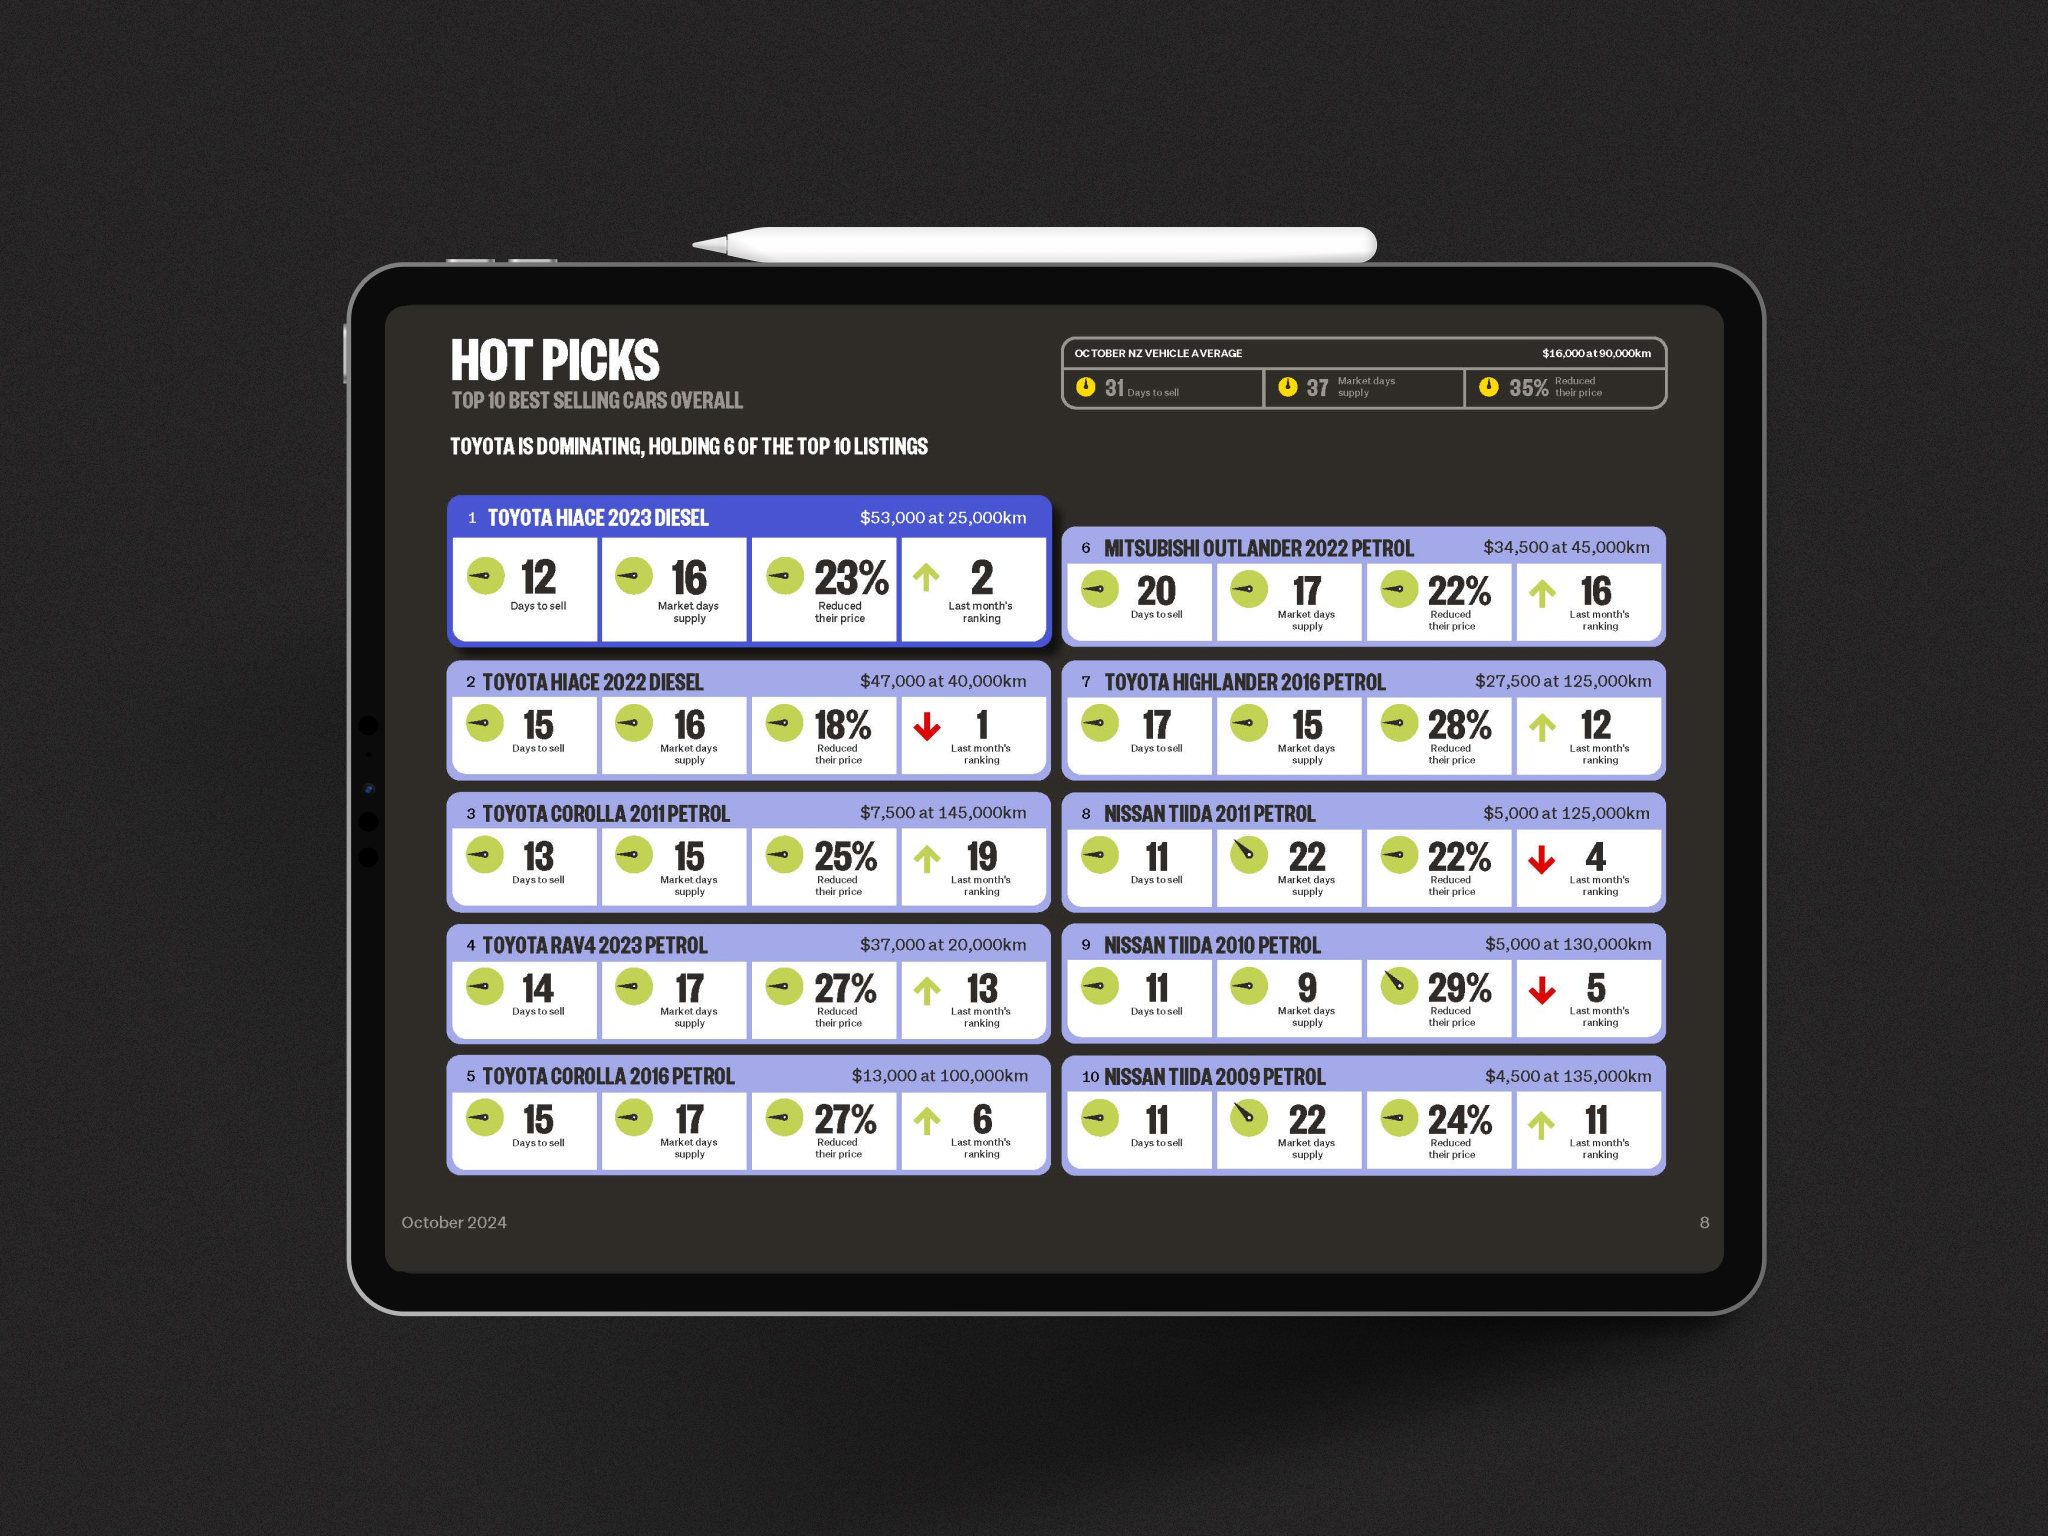
I designed a repeatable monthly template that helps dealers understand how the previous month performed nationwide. The structure and storytelling needed to be easy to understand and actionable.
I created a reusable 'widget' that helps users quickly digest how a vehicle is performing.
Using Trade Me Motors data to help users understand performance, I created a design system that is easy to understand and sits well within auto visual language and also clearly Trade Me branded.

Let's talk.
© Sandidash Limited. All rights reserved.